
Macroeconomic and industry conditions
The International Monetary Fund (IMF) estimates that, with growth of 3.1%, the global economy performed slightly better in 2023 than had been forecast a year ago. However, historically speaking, 2023 was one of the weakest years in terms of growth in the last three decades, with the exception of the recession years. Only in 2019 was growth lower at +2.8%. In the United States (+2.5%) as well as in several major emerging markets and developing countries, gross domestic product was higher in 2023 than initially expected. In the case of the United States, this performance was materially underpinned by dynamic consumer spending. In the Eurozone, however, consumers remained cautious in the face of high inflation and energy costs. In addition, significantly higher financing costs took their toll on private consumption and corporate capital spending. The direct and indirect negative effects of the war in Ukraine are still evident the most clearly in Europe. In China, the real estate sector, geopolitical upsets with the United States and the EU as well as muted industrial spending impeded the economic recovery.
Compared to 2022, global economic growth thus slowed by 0.4 percentage points. Among the European countries, Spain performed better than the other member states with growth of 2.4%. Germany was the only advanced economy to record minus of 0.3%. As in the previous year, India (+6.7%), China (+5.2%) and the ASEAN countries (+4.2%) recorded the greatest growth.
According to the German Mechanical and Plant Engineering Association (VDMA), EU mechanical engineering contracted by -1.4% in 2023 in price and calendar-adjusted terms after growth of 5% in the previous year. According to the VDMA president, possible reasons for the decline are the high order backlogs and reduced supply chain bottlenecks, with the exception of electronic components, which are occasionally still in short supply. In particular, the decline in machine production at the end of 2023 is reflected in the figures, with production output in mechanical and plant engineering rising by 0.9% in the first 10 months. Cumulative revenue growth reached -0.1% for 2023. In the printing press segment, revenue contracted by 1.0%. Order intake declined by 17% over the previous year.
According to preliminary calculations by the Federal Statistical Office, mechanical and plant engineering production in Germany fell by 0.6% over the previous year in 2023. A challenging economic environment characterised by high uncertainty led to noticeable ordering restraint, placing a damper on production capacity utilisation towards the end of the year. In the first half of the year, the high order backlogs were still able to support production, but gradually subsided over the course of the year. On the basis of one survey, VDMA continues to see the high shortage of skilled workers, bureaucratic burdens, the high energy prices, labour costs and the high taxes as challenges.
Source: VDMA, issue “Mechanical Engineering Economy 2023/Outlook 2024” from 12 March 2024.
Year-on-year gross domestic product (%)
Country/region | 2021 | 2022 | 2023 (estimate) |
| Global | 6.3 | 3.5 | 3.1 |
| Developed economies | 5.6 | 2.6 | 1.6 |
| Eurozone | 5.6 | 3.4 | 0.5 |
| Germany | 3.2 | 1.8 | -0.3 |
| France | 6.4 | 2.5 | 0.8 |
| Italy | 7.0 | 3.7 | 0.7 |
| Spain | 6.4 | 5.8 | 2.4 |
| United Kingdom | 7.6 | 4.3 | 0.5 |
| United States | 5.9 | 1.9 | 2.5 |
| Japan | 2.2 | 1.0 | 1.9 |
| Emerging markets and developing countries | 6.9 | 4.1 | 4.1 |
| ASEAN* | 4.0 | 5.5 | 4.2 |
| Brazil | 5.0 | 3.0 | 3.1 |
| China | 8.5 | 3.0 | 5.2 |
| India** | 9.1 | 7.2 | 6.7 |
| Russia | 5.6 | -1.2 | 3.0 |
*) Indonesia, Malaysia, Philippines, Thailand, Vietnam
**) Fiscal year from 1 April to 31 March
Source: IMF World Economic Outlook Update January 2024, for 2021: IMF October 2023 Database.
Business performance
Overall statement on business performance
The Koenig & Bauer Group’s business performance in 2023 was characterised by challenging conditions due to ongoing inflation and rising costs. On a positive note, supply chain problems and the enormous price increases are receding in part.
However, the Koenig & Bauer Group took extensive precautions at an early stage to prepare for the challenging situation. The company was able to officially end the P24x efficiency programme, which had been adopted in September 2020, in the middle of the year as the savings targets had been achieved. With no sign of any recovery in demand, the company stepped up its cost management efforts in the third quarter. This also involved the greater use of flexible working time instruments. As in the previous year, short-time working was used to a minor extent at two locations due to capacity utilisation factors. Towards the end of the financial year, the Management Board initiated the “Spotlight” focus programme with the aim of prioritising initiatives and business models that boost earnings and financial strength, deprioritising initiatives that do not directly impact earnings and optimising the Group and segment organisation as well as the indirect cost structure to make processes even leaner and more customer-friendly.
In 2023, the Koenig & Bauer Group generated revenue of €1,326.8m (previous year: €1,185.7m) and consolidated earnings before interest and taxes (EBIT) of €29.9m (previous year: €22.0m), resulting in an EBIT margin of 2.3% (previous year: 1.9%). The year under review saw positive and negative special effects, which in general terms virtually balanced each other out.
The segments contributed the following revenue in 2023: Sheetfed: €779.8m (previous year: €672.2m), Digital & Webfed: €172.3m (previous year: €139.8m), Special: €413.7m (previous year: €417.1m). At €1,326.8m, Group revenue was at the upper end of the forecast of €1.3bn that had been adjusted on 8 November 2023 and was also in line with the original forecast.
The segments contributed the following EBIT in the year under review: Sheetfed: €29.8m (previous year: €19.0m), Digital & Webfed: € -23.9m (previous year: €–19.3m), Special: €23.0m (previous year: €23.2m). At €29.9m, EBIT (2.3% EBIT margin) was within the adjusted forecast range of €25m to €35m (1.9–2.7% EBIT margin). The original forecast had assumed an EBIT margin of around 3%, accompanied by Group revenue of €1.3bn. The Digital & Webfed segment should make a disproportionately strong contribution to both EBIT and revenue growth. The aforementioned special effects had a negative impact on EBIT in the Digital & Webfed segment mainly due to start-up and trailing costs, whereas EBIT in the Special segment was spurred by positive effects.
To strengthen the Group’s stability and strategic flexibility, the existing syndicated loan was successfully refinanced ahead of schedule at the end of October 2023. The new syndicated facility replaces the existing arrangements, which were due to expire at the end of 2024. This also eliminates all the restrictions associated with the loan granted by KfW in connection with the Covid-19 pandemic.
Financially, the Koenig & Bauer Group is well positioned, with a Group equity ratio of roughly 28.7% (previous year: 29.2%) and more than €150m in freely available cash and cash equivalents. This was also aided by active net working capital management in the year under review. In view of the earnings performance in 2023 and the persistently challenging global economic market environment, the Management Board and the Supervisory Board will be proposing at the Annual General Meeting that the net profit generated by the holding company Koenig & Bauer AG be retained and that a dividend be omitted for the 2023 financial year. However, as Koenig & Bauer attaches great importance to ensuring an appropriate participation of its shareholders in the company’s success, a future dividend policy has been adopted which, subject to profitable business performance during the year, aims to distribute a dividend of 15–35% of consolidated earnings, with a minimum dividend of €0.30 per share.
To summarise, the Koenig & Bauer Group’s business performance and situation were in line with expectations, taking into account the global challenges in 2023 and the adjusted forecast.
Earnings
Group order intake
| €m | 2022 | 2023 |
| Sheetfed | 813.5 | 606.2 |
| Digital & Webfed | 136.6 | 179.8 |
| Special | 392.9 | 538.8 |
| Reconciliation | -40.7 | -36.9 |
| Total | 1,329.3 | 1,287.9 |
At the end of 2023, order intake amounted to €1,287.9m, thus falling short of the previous year’s historically high figure of €1,329.3m by 3.1%. The following picture emerged in the segments: While the increase of 25.5% in Sheetfed’s order intake was below the extremely high figure recorded in the previous year, Digital & Webfed posted a slight increase of 9.9%. In Special, a significant increase of 37.1% was observed. Overall, order intake in the Koenig & Bauer Group was thus far above the industry average for printing presses, which declined by 17% in 2023 according to VDMA.
Group revenue
| €m | 2022 | 2023 |
| Sheetfed | 672.2 | 779.8 |
| Digital & Webfed | 139.8 | 172.3 |
| Special | 417.1 | 413.7 |
| Reconciliation | -43.4 | -39.0 |
| Total | 1,185.7 | 1,326.8 |
Group revenue by product group
| €m | 2022 | 2023 |
| Service | 353.7 | 383.5 |
| Printing presses | 821.3 | 925.3 |
| Other | 10.7 | 18.0 |
Group revenue by region
| €m | 2022 | 2023 |
| Germany | 134.7 | 173.3 |
| Rest of Europe | 414.4 | 386.8 |
| North America | 243.4 | 300.1 |
| Asia/Pacific | 286.1 | 325.8 |
| Africa/Latin America | 107.1 | 140.8 |
| Total | 1,185.7 | 1,326.8 |
| in % | ||
| Germany | 11.4 | 13.1 |
| Rest of Europe | 34.9 | 29.1 |
| North America | 20.5 | 22.6 |
| Asia/Pacific | 24.1 | 24.5 |
| Africa/Latin America | 9.1 | 10.7 |
At €1,326.8m, Group revenue exceeded the previous year’s figure of €1,185.7m by 11.9%. In this respect, the segments performed consistently with a stronger second half and with the following overall situation at the end of the year: While Sheetfed revenue rose by 16.0%, Digital & Webfed posted an increase of 23.2%. In Special, revenue was down on the previous year by 0.8%. Overall, revenue in the Koenig & Bauer Group was thus far above the industry average for printing presses, which declined by 1.0% in 2023 according to VDMA. The book-to-bill ratio of 0.97 (previous year: 1.12) was in line with expectations. In 2023, 28.9% of revenue was generated from service business (previous year: 29.8%).
The Group export ratio declined slightly from 88.6% to 86.9%, with the share of business in Asia growing to 24.5% (previous year: 24.1%), while the share of business from North America also widened to 22.6% (previous year: 20.5%). The share of business from Germany likewise increased to 13.1% (previous year: 11.4%) and from Latin America and Africa to 10.7% (previous year: 9.1%). At 29.1%, the share of business accounted for by the rest of Europe fell short of the previous year’s figure of 34.9%.
Group order backlog
| €m | 2022 | 2023 |
| Sheetfed | 582.9 | 409.3 |
| Digital & Webfed | 112.3 | 119.8 |
| Special | 253.4 | 378.5 |
| Reconciliation | 1.8 | 3.9 |
| Total | 1,290.6 | 911.5 |
As planned, the order backlog contracted from €950.4m to €911.5m at the end of the year as a result of completed deliveries and continues to serve as a solid basis for 2024.
Group income statement
| €m | 2022 | 2023 |
| Revenue | 1,185.7 | 1,326.8 |
| Cost of sales | -868.3 | -979.3 |
| Gross profit | 317.4 | 347.5 |
| Research and development costs | -54.2 | -57.5 |
| Distribution costs | -147.3 | -158.1 |
| Administrative expenses | -92.8 | -104.7 |
| Other operating income | -26.5 | 24.9 |
| Impairment gains and losses on financial assets | 0.3 | 3.0 |
| Other financial result | -0.8 | 0.6 |
| Earnings before interest and taxes (EBIT) | 22.0 | 29.9 |
| Other interest and similar income | 1.3 | 2.3 |
| Other interest and similar expenses | -10.1 | -19.2 |
| Interest result | -8.8 | -16.9 |
| Earnings before taxes (EBT) | 13.2 | 13.0 |
| Income tax expense | -2.1 | -10.2 |
| Net profit | 11.1 | 2.8 |
| of which | ||
| attributable to owners of the Parent | 10.4 | 2.6 |
| attributable to non-controlling interests | 0.7 | 0.2 |
| Earnings per share (€, diluted/basic) | 0.63 | 0.9 |
Gross profit increased to €347.5m (previous year: €317.4m) despite the higher production costs. At 26.2%, the gross margin was almost at the previous year’s level of 26.8%. At €57.5m (previous year: €54.2m), R&D expenses were up on the previous year, partly due to the new Digital Business Unit, which is responsible for digitalisation within the Group. Distribution costs increased by €10.8m to €158.1m (previous year: €147.3m), mainly as a result of generally higher service costs in addition to the rise in personnel costs. Administrative expenses climbed by €11.9m over the previous year to €104.7m (previous year: €92.8m) due to the higher amortisation of intangible assets in the Group, among other things. Net other expenses came to €-0.9m, compared with €-0.6m in the previous year. Among other things, this was due to currency-translation effects. All told, this resulted in EBIT of €29.9m (previous year: €22.0m), equivalent to an EBIT margin of 2.3%, compared with 1.9% in the previous year.
The improvement of €7.9m in operating earnings despite the start-up and trailing costs in the Digital & Webfed segment (€9.3m) and other effects (€3.2m) is mainly due to the positive overall volume and mix effects (€19.3m) and the ability to pass on the inflation-related increases in material, energy and personnel costs (€24.1m) through the announced price increases (€25.2m). Net interest expense of €-16.9m was higher than in the previous year (previous year: €-8.8m), mainly due to higher interest rates charged by banks, resulting in earnings before taxes of €13.0m (previous year: €13.2m). After income taxes of €10.2m (previous year: €2.1m), the Group posted net profit of €2.8m in 2023 (previous year: €11.1m). This translates into earnings per share of €0.16 (previous year: €0.63).
Finances
Cash flow from operating activities came to €-31.8m mainly due to lower liabilities and other liabilities as well as declining receivables and other assets in the period under review and higher interest paid (previous year: €5.4m). At €–61.6m, cash flow from investing activities was slightly up on the previous year’s figure of €–65.1m, which had included the acquisition of an interest in Celmacch. Free cash flow amounted to €-93.4m (previous year: €–59.7m). Net working capital stood at €379.0m as of 31 December 2023 (previous year: €332.6m) and improved by €22.4m due to a supply chain optimisation programme. Cash flow from financing activities came to €61.2m (previous year: €59.4m), reflecting changes in the syndicated loan. At the end of December 2023, cash and cash equivalents were valued at €96.4m (previous year: €132.2m). Adjusted for bank liabilities of €244.0m (previous year: €195.9m), net financial debt amounted to €-147.6m (previous year: €-63.7m).
At the end of October, the company was able to successfully refinance its existing syndicated loan ahead of schedule, thus securing the medium-term stability of its funding operations. The early termination of the loan granted by KfW in connection with the Covid-19 pandemic resulted in all the restrictions imposed on the company under the terms of this loan being lifted. The new syndicated facility replaces the existing arrangements, which were due to expire at the end of 2024. In addition to a revolving cash facility of €300m, the syndicated finance includes a guarantee facility of €200m. The credit facilities have a tenor of five years, meaning that they will expire in October 2028, subject to a two-year renewal option in agreement with the borrowers. To highlight the importance that Koenig & Bauer attaches to sustainability in its funding operations, the agreement now includes an ESG rendezvous clause in addition to the usual Loan Market Association (LMA) stipulations. This is to be implemented in 2024, subject to the consent of all parties involved. The Group-wide external financing framework also consists of further bilateral credit facilities, including for guarantee lines.
Assets
As of 31 December 2023, equity stood at €410.0m and the equity ratio at 28.7% (31 December 2022: €422.8m and 29.2%). This was mainly due to the reduction in the discount rate on domestic pensions and the lower net profit of €2.8m compared to the previous year (31 December 2022: €11.1m). The Koenig & Bauer Group’s total assets came to €1,427.1m as of 31 December 2023 (previous year: €1,449.2m).
Assets
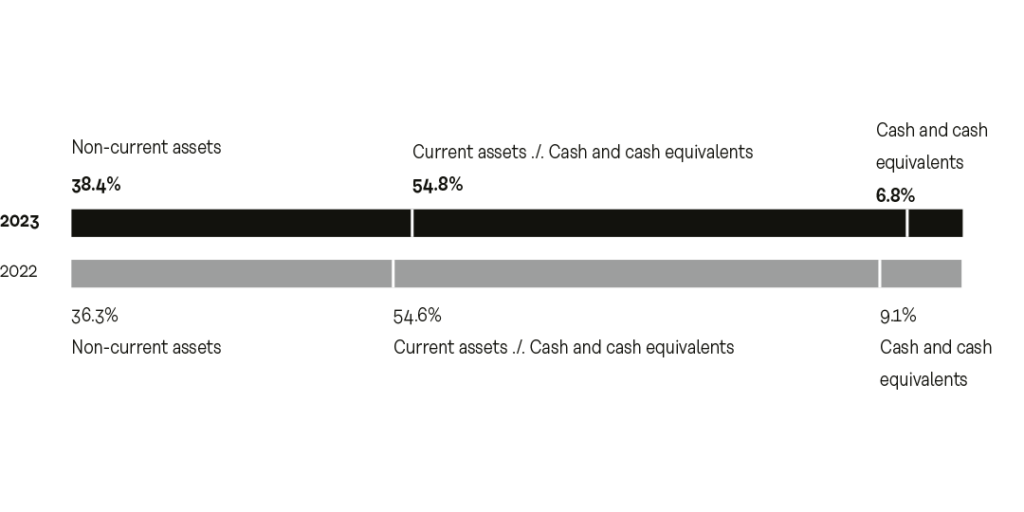
A total of €64.2m (previous year €49.8m) was spent on property, plant and equipment and intangible assets in connection with construction and IT projects in the period under review. Capital spending includes capitalised development costs of €17.2m (previous year: €5.1m). This was accompanied by depreciation and amortisation expense of €43.5m (previous year: €40.0m). On balance, intangible assets and property, plant and equipment rose slightly from €393.6m to €411.1m. Non-current assets increased by €21.7m to €548.2m compared to the previous year, due to increases in intangible assets of €10.7m to €155.6m (previous year: €144.9m) and property, plant and equipment of €6.8m to €255.5m (previous year: €248.7m), as well as slightly higher other assets and marginally increased deferred tax assets. Current assets decreased by €43.8m to €878.9m as of 31 December 2023 (previous year: €922.7m). This is mainly due to the decline of €50.8m in other assets to €149.4m (previous year: €200.2m) and of €35.8m in cash and cash equivalents to €96.4m (previous year: €132.2m). Trade receivables increased by €34.6m to €156.2m as of 31 December 2023 (previous year: €121.6m) due to revenue effects. At €1,427.1m, the Group’s total assets fell short of the figure of €1,449.2m recorded at the end of 2022.
Equity and liabilities
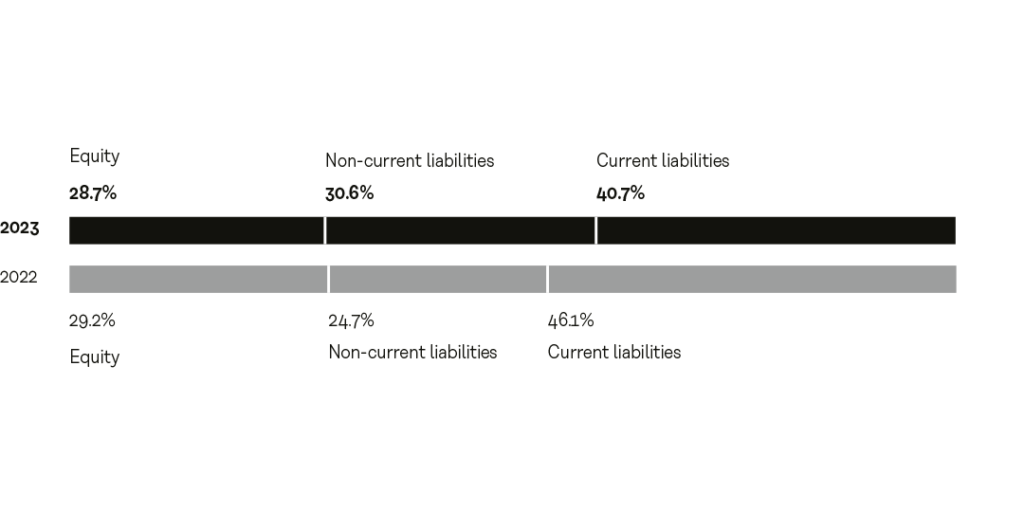
The decrease in the discount rate for domestic pensions and the lower net profit of €2.8m (previous year: €11.1m) were materially responsible for the decline in equity from €422.8m as of 31 December 2022 to €410.0m as of the end of 2023. Accordingly, the equity ratio also contracted to 28.7% as of the reporting date (end of 2022: 29.2%). Provisions for retirement benefits increased by €18.5m to €104.8m as of 31 December 2023 (previous year: €86.3m) due to the aforementioned drop in the discount rate for domestic pensions from 3.9% in the previous year to 3.4% as of 31 December 2023. In total, non-current liabilities increased by €77.2m to €435.9m (previous year: €358.7m). Current liabilities fell by €86.5m over the end of 2022 to €581.2m (previous year: €667.7m). This was due to the decrease of €16.9m in other provisions to €89.7m (previous year: €106.6m) and of €25.4m in trade payables to €79.3m (previous year: €104.7m) due to lower inbound deliveries from our suppliers. In addition, financial liabilities and other financial liabilities fell by €13.3m to €138.6m (previous year: €151.9m) mainly due to the reduced use of the syndicated loan. Other liabilities and income tax liabilities fell by €30.9m to €273.6m (previous year: €304.5m) as of 31 December 2023 primarily as a result of prepayments received.
Segment performance
At €606.2m, order intake in the Sheetfed segment fell short of the extremely high figure of €813.5m recorded in the previous year following a sequential improvement in the fourth quarter. However, the previous year had been characterised by post-pandemic catch-up effects as well as greater stockpiling by customers and brand owners as a result of supply chain and material bottlenecks. After a strong final quarter, revenue increased by 16.0% to €779.8m (previous year: €672.2m). With a book-to-bill ratio of 0.78 (previous year: 1.21), the order backlog contracted by 29.8% to €409.3m (previous year: €582.9m). At €29.8m, EBIT was up 56.8% on the previous year’s figure of €19.0m, further widening its positive contribution to earnings. Reflecting this, the EBIT margin stood at 3.8% (previous year: 2.8%).
Order intake in the Digital & Webfed segment continued to recover, increasing by €16.2m to €179.8m (previous year: €163.6m). At the end of the year, revenue was up 23.2%, climbing to €172.3m (previous year: €139.8m), not least due to a strong final quarter. With a book-to-bill ratio of 1.04 (previous year: 1.17), the order backlog increased by €7.5m to €119.8m (previous year: €112.3m). The segment generated EBIT of €-23.9m, compared with €-19.3m in the previous year, yielding an EBIT margin of -13.9% (previous year: -13.8%). EBIT fell by €7.7m on balance in the year under review due to special effects, mainly the start-up and trailing costs in connection with the introduction of the new flexo, corrugated board and digital printing products.
In the Special segment, order intake increased by 37.1% to €538.8m as of 31 December 2023 (previous year: €392.9m). In the fourth quarter alone, order intake reached €268.1m, This was due to an order in the Banknote Solutions business unit from the U.S. Bureau of Engraving and Printing in Washington, D.C. Orders for coding (marking solutions for all industries) and MetalPrint (metal packaging) were lower than in the previous year, while orders placed with Kammann (direct decoration of hollow bodies made of glass or plastic) were up. Revenue fell slightly by €3.4m to €413.7m (previous year: €417.1m). With a book-to-bill ratio of 1.30 (previous year: 0.94), the order backlog widened by 49.4% to €378.5m (previous year: €253.4m). At €23.0m in the period under review, EBIT was virtually unchanged over the previous year’s figure of €23.2m. Accordingly, the EBIT margin of 5.6% was in line with the previous year (5.6%). On balance, EBIT was €6.0m higher in the reporting period due to special effects.