
Business report
Macroeconomic and industry conditions
The global economy developed in 2025 in an environment of profound trade policy realignments and ongoing geopolitical tensions. According to estimates by the International Monetary Fund (IMF), the global economy recorded real moderate growth of 3.3% (previous year: 3.3%). Dynamism thus remained perceptibly below the historical average of 3.7% for the years 2000 to 2019. The reporting year was significantly shaped by the introduction of extensive US tariff measures, which led to a clear increase in uncertainty in global trade policy. The global inflation rate continued its decline and reached an annual average of 4.1% (previous year: 5.8%).
Developments varied from region to region. The US economy grew by 2.1% in 2025. The slowdown compared to the previous year (+2.8%) resulted from trade policy burdens as well as a temporary shutdown of government business (shutdown) at the end of the year. Support came from a continued high level of investment in artificial intelligence (AI) and a moderately expansive fiscal policy. In the Eurozone, economic growth stood at 1.4% (previous year: 0.9%). However, the slight recovery was slowed by uncertainty over future trade relations, lagging energy price effects, and the introduction of additional US tariff measures, which amounted to a negative external demand shock for Europe’s export-oriented economies. Within the Eurozone, Spain again recorded above-average performance at 2.9%.
Germany returned to a weak growth path of 0.2% after two consecutive years of recession (previous year: -0.5%). The export-oriented German industry suffered particularly from the increasing fragmentation of world trade, while rising government spending had a stabilising effect on the domestic economy. In Japan, the economy succeeded in growing by 1.1% (previous year: -0.2%). Emerging markets and developing countries grew by a total of 4.4%. In China, economic growth was 5.0% (previous year: 5.0%). Structural problems in the real estate sector had a negative impact here, while exports performed more robustly than expected, supported by a temporary trade agreement with the USA. India remained one of the world’s most important growth drivers with a plus of 7.3% (previous year: 6.5%).
| Country/region | 2023 | 2024 | 2025 (estimate) |
| Global | 3.5 | 3.3 | 3.3 |
| Developed economies | 1.7 | 1.8 | 1.7 |
| Eurozone | 0.4 | 0.9 | 1.4 |
| Germany | -0.9 | -0.5 | 0.2 |
| France | 1.6 | 1.1 | 0.8 |
| Italy | 0.7 | 0.7 | 0.5 |
| Spain | 2.5 | 3.5 | 2.9 |
| United Kingdom | 0.4 | 1.1 | 1.4 |
| United States | 2.9 | 2.8 | 2.1 |
| Japan | 1.2 | -0.2 | 1.1 |
| Emerging markets and developing countries | 4.7 | 4.3 | 4.4 |
| ASEAN* | 4.1 | 4.6 | 4.2 |
| Brazil | 3.2 | 3.4 | 2.5 |
| China | 5.4 | 5.0 | 5.0 |
| India** | 9.2 | 6.5 | 7.3 |
| Russia | 4.1 | 4.3 | 0.6 |
*) Indonesia, Malaysia, Philippines, Singapore, Thailand
**) Fiscal year from 1 April to 31. March
Source: IMF World Economic Outlook Update January 2026, for 2023: IMF October 2025 Database.
Trade policy conditions and currency effects in the US market were of particular relevance to Koenig & Bauer. In the course of the trade agreement between the EU and the USA, a uniform tariff cap of 15% applied to the vast majority of EU exports to the USA from 7 August 2025 until 20 February 2026, replacing the significantly higher tariffs in some cases. However, exceptions to this cap remain for listed products made of steel, copper, and aluminium, for which tariffs of at least 50% continue to apply. In addition, punitive tariffs of at least 50% are levied on products which the US administration (pursuant to Section 232 of the Trade Expansion Act) has classified as derivatives of steel, copper, and aluminium based on the customs tariff number. This currently includes flexographic printing presses as well as a large number of spare parts for printing presses. As Section 232 is subject to continuous updates by the US administration, it cannot be ruled out that further products relevant to Koenig & Bauer will be included. This means that the company’s machines, systems, and spare parts have become more expensive in the USA since August. In addition, EUR/USD developments resulted in a further increase in the price of services in the USA.
The demand for capital goods developed in 2025 against the backdrop of significant shifts within global supply chains and volatile trade policy. In anticipation of higher trade barriers, there were premature orders (“front-loading”) in the first half of the year in particular, which temporarily supported capacity utilisation but led to a noticeable normalisation of demand later in the year. According to the VDMA, real machinery production in Europe was shaped by a pronounced recession. Despite the challenging market environment, mechanical engineering worldwide recorded slight price-adjusted revenue growth of almost 2%. This development was primarily due to the delayed processing of high order backlogs from 2024. New business, on the other hand, remained under pressure due to high costs, restrictive investment budgets, and weak demand from the automotive, construction, and chemical industries.
Mechanical and plant engineering in Germany shrank by 2.6% year-on-year in 2025 according to preliminary calculations. This was clearly reflected in market data: while price-adjusted domestic order intake fell by 1.5%, revenue in Germany recorded a minus of 5.8%.
In the printing press segment, order intake in 2025 fell by 10.6% in price-adjusted terms compared to the previous year. On the revenue side, however, the segment recorded a clear plus of 8.1%, which was primarily due to the processing of existing order backlogs.
Business performance
Overall statement on business performance
The Koenig & Bauer Group`s business performance in 2025 was characterised by an unchanged weak macroeconomic market environment. Conditions were defined by geopolitical tensions and trade conflicts, leading to a high level of global uncertainty. In particular, uncertainties regarding US tariff policy led to perceptible hesitation in customer investments at times.
Since the start of the 2025 financial year, Koenig & Bauer has been managing the Group through two segments Paper & Packaging Sheetfed Systems (P&P) and Special & New Technologies (S&T). This new structure is even more precisely tailored to customer needs and more closely aligned with the respective business model. In the P&P segment, Koenig & Bauer bundles activities for folding cartons and corrugated board to offer customers end-to-end solutions for packaging production as a full-service provider. The S&T segment combines special applications and digital solutions, with the business units acting with a high degree of entrepreneurial autonomy.
With regard to the order situation, the expected normalisation after the record year of 2024 led to an order intake of €1,233.2m (previous year: €1,402.7m). This decline results primarily from the phasing-out of the extraordinary “drupa effect” as well as a very high previous-year value at Banknote Solutions. Nevertheless, at €970.6m as of 31 December 2025, the order backlog remains at a high level (previous year: €1,039.8m) and forms a solid basis for the 2026 financial year. Financial performance became increasingly positive over the course of the year after a typically subdued first quarter. Thanks to strong operational performance in the third quarter, it was possible to noticeably smooth out the earnings trend in the second half of the year and significantly reduce dependency on the fourth quarter compared to the previous year. Consequently, the guidance specified in November 2025, which saw target achievement for operating EBIT with a higher probability in the lower half of the corridor due to macroeconomic uncertainties, was achieved spot-on.
Accordingly, the Koenig & Bauer Group achieved revenue of €1,302.4m in the 2025 financial year (guidance: slight revenue growth; previous year: €1,274.4m) and an operating EBIT of €36.6m (guidance: increase to €35 – 50m; previous year: €15.3m). This corresponds to an operating EBIT margin of 2.8% (previous year: 1.2%).
The 2025 reporting year was characterised by significantly reduced extraordinary items. Non-operating extraordinary items decreased significantly year-on-year to €5.3m (previous year: €50.4m) and comprised the final planned expenses for the completion of the “Spotlight” focus programme and mainly concerned material cost adjustments. In the previous year, extraordinary items were also burdened by one-off costs for the world-leading trade fair drupa amounting to €10.5m.
Thus, Group EBIT improved significantly by +€66.4m to €31.3m (previous year: €-35.1m), corresponding to an EBIT margin of 2.4% (previous year: -2.8%).
The segments contributed to operating EBIT as follows: Paper & Packaging Sheetfed Systems (P&P) €25.0m (guidance: slight increase; previous year: €17.1m) and Special & New Technologies (S&T) €9.0m (guidance: significant increase; previous year: €-15.4m). In 2025, the segments contributed to revenue as follows: P&P €741.5m (guidance: slight increase; previous year: €734.8m) and S&T €596.0m (guidance: slight increase; previous year: €558.0m).
Due to the aforementioned non-operating extraordinary items from “Spotlight”, S&T segment EBIT was burdened by €2.8m in other restructuring expenses. The segment performance is described in detail in the “Segment performance” chapter on page 39.
Financially, the Koenig & Bauer Group is well positioned with a Group equity ratio of 24.0% (previous year: 23.3%) and more than €150m in freely available liquid funds. Active net working capital management in the reporting period also contributed to this.
In view of the earnings performance 2025 and the persistently challenging global economic market environment, the Executive Board and Supervisory Board will be proposing at the annual general meeting that a dividend be omitted for the financial year as a result of the net loss reported by Koenig
& Bauer AG. As Koenig & Bauer attaches great importance to ensuring the appropriate participation of its shareholders in the company’s success, the dividend policy provides for the distribution of a dividend of 15 – 35% of consolidated earnings, with a minimum dividend of €0.30 per share, subject to profitable business performance during the year.
To summarise, the Koenig & Bauer Group’s business performance and business situation were in line with expectations, taking into account the global challenges in 2025.
Earnings
Group order intake
| €m | 2024 | 2025 |
| Paper & Packaging Sheetfed Systems | 732.5 | 704.0 |
| Special & New Technologies | 695.6 | 558.4 |
| Reconciliation | -25.4 | -29.2 |
| Total | 1,402.7 | 1,233.2 |
The order intake of the Koenig & Bauer Group amounted to €1,233.2m and was thus -12.1% below the strong previous-year figure as expected. This decline results significantly from base effects from the previous year, which was shaped by the drupa trade fair and exceptionally high order intake at Banknote Solutions (BNS). In addition, volatile geopolitical conditions and temporary uncertainties regarding US tariff policy dampened the willingness to invest in individual markets.
In the segments, the picture was as follows: Order intake in the Paper & Packaging Sheetfed Systems (P&P) segment was extremely resilient at €704.0m compared to the drupa previous year, recording only a moderate decline of -3.9% (previous year: €732.5m). The Special & New Technologies (S&T) segment, as expected, fell behind the previous year’s value with an order intake of €558.4m (previous year: €695.6m). This decline is primarily attributable to the base effect mentioned in the BNS area, after the S&T segment had benefited from a large order from the US Bureau of Engraving and Printing in the previous year.
Thus, orders in the Group developed slightly below the industry average for printing presses, which according to VDMA figures recorded a drop in order intake of -10.6% for 2025.
Group revenue
| €m | 2024 | 2025 |
| Paper & Packaging Sheetfed Systems | 734.8 | 741.5 |
| Special & New Technologies | 558.0 | 596.0 |
| Reconciliation | -18.4 | -35.1 |
| Total | 1,274.4 | 1,302.4 |
Group revenue by product group
| €m | 2024 | 2025 |
| Service | 396.9 | 399.3 |
| Printing presses | 862.1 | 883.8 |
| Other | 15.4 | 19.3 |
| Total | 1,274.4 | 1,302.4 |
Group revenue by region
| €m | 2024 | 2025 |
| Germany | 163.7 | 143.4 |
| Rest of Europe | 364.9 | 386.9 |
| North America | 367.1 | 313.8 |
| Asia/Pacific | 262.5 | 349.3 |
| Africa/Latin America | 116.2 | 109.0 |
| Total | 1,274.4 | 1,302.4 |
| % | 2024 | 2025 |
| Germany | 12.9 | 11.0 |
| Rest of Europe | 28.6 | 29.7 |
| North America | 28.8 | 24.1 |
| Asia/Pacific | 20.6 | 26.8 |
| Africa/Latin America | 9.1 | 8.4 |
The Koenig & Bauer Group revenue rose by 2.2% to €1,302.4m in an unchanged challenging macroeconomic environment. Sequentially, revenue performance improved in both segments from quarter to quarter, resulting in a typically strong second half of the year, supported by the consistent processing of the high order backlog.
In the Paper & Packaging Sheetfed Systems (P&P) segment, revenue was increased slightly by 0.9% to €741.5m (previous year: €734.8m). The Special & New Technologies (S&T) segment recorded a more dynamic development and increased revenue by 6.8% to €596.0m (previous year: €558.0m).
The revenue of the Koenig & Bauer Group thus developed below the industry revenue for printing presses, which according to VDMA figures recorded a plus of 8.1% in 2025. The normalisation of order intake after the drupa year combined with increased revenue is reflected in the book-to-bill ratio of 0.95 (previous year: 1.10). Service business was increased in absolute figures to €399.3m (previous year: €396.9m). The slight decrease in the percentage share of revenue from 31.1% to 30.7% in the reporting year is purely attributable to the growth in new machine and other business, which increased total revenue more strongly overall.
The Group export ratio increased from 87.1% in the previous year to 89.0% in the reporting year. Good business performance in the Asia/Pacific region contributed significantly to this development, leading to an increase in the revenue share in this region to 26.8% (previous year: 20.6%). The share in the rest of Europe also increased slightly to 29.7% (previous year: 28.6%). By contrast, shares in North America decreased to 24.1% (previous year: 28.8%), in Germany to 11.0% (previous year: 12.9%), and in Latin America and Africa to 8.4% (previous year: 9.1%) as expected.
Group order backlog
| €m | 2024 | 2025 |
| Paper & Packaging Sheetfed Systems | 407.0 | 369.5 |
| Special & New Technologies | 635.8 | 598.2 |
| Reconciliation | -3.0 | 2.9 |
| Total | 1,039.8 | 970.6 |
Order backlog as of 31 December 2025 remains at a historically high level at €970.6m (previous year: €1,039.8m). The 6.7% decline compared to the previous year results on the one hand from the normalisation of order intake after the exceptionally strong previous year. On the other hand, the change in the order backlog reflects the consistent processing of orders and their conversion into Group revenue in the reporting year. The order backlog thus continues to serve as a solid basis for the 2026 financial year and beyond, although it is not distributed evenly across the segments.
Group income statement
| €m | 2024 | 2025 |
| Revenue | 1,274.4 | 1,302.4 |
| Cost of sales | -979.4 | -961.8 |
| Gross profit | 295.0 | 340.6 |
| Research and development costs | -54.5 | -46.2 |
| Selling costs | -171.0 | -155.3 |
| Administrative costs | -104.0 | -106.5 |
| Other operating income | 19.4 | 37.4 |
| Other operating expenses | -23.7 | -38.4 |
| Remeasurement gains and losses | 3.3 | -0.1 |
| Other financial result | 0.4 | -0.2 |
| Earnings before interest and taxes (EBIT) | -35.1 | 31.3 |
| Other interest and similar income | 4.9 | 2.9 |
| Other interest and similar expenses | -29.0 | -26.6 |
| Interest result | -24.1 | -23.7 |
| Earnings before taxes (EBT) | -59.2 | 7.6 |
| Income taxes | -10.6 | -21.1 |
| Group loss | -69.8 | -13.5 |
| of which | ||
| Shareholder of the parent company | -70.1 | -13.5 |
| Non-controlling interests | 0.3 | – |
| Earnings per share (€, diluted/basic) | -4.24 | -0.81 |
Gross profit improved significantly in the reporting period due to the earnings effect from the “Spotlight” focus programme and a more advantageous product mix by 15.5% to €340.6m (previous year: €295.0m) with an increased gross margin of 26.2% (previous year: 23.1%). Research & development expenses decreased by 15.2% to €46.2m (previous year: €54.5m), which is mainly attributable to the consistent go-to-market approach for products. Selling expenses decreased by 9.2% to €155.3m (previous year: €171.0m), mainly due to the costs incurred in the previous year for the world-leading trade fair drupa. Administrative expenses increased slightly by 2.4% to €106.5m (previous year: €104.0m), due to general price increases (rents, leases, IT leasing, insurance). The balance of impairment gains and losses on financial assets, other expenses and income, and the financial result stood at €-1.3m (previous year: €-0.6m).
In total, this resultet in EBIT of €31.3m (previous year: €-35.1m), corresponding to an EBIT margin of 2.4% (previous year: -2.8%). In addition to a positive volume effect of €4.9m, positive other operating effects of €6.0m also contributed to the improvement in earnings. In addition to mix and price effects, these include the planned gross cost savings from the “Spotlight” focus programme.
Non-operating extraordinary items decreased significantly year-on-year to €5.3m (previous year: €50.4m). These comprised the final planned expenses for the completion of the “Spotlight” focus programme and mainly concern other restructuring expenses. In the previous year, extraordinary items were also burdened by one-off costs for the world-leading trade fair drupa amounting to €10.5m, which were not incurred in the reporting year.
Accordingly, operating EBIT stood at €36.6m (previous year: €15.3m), corresponding to an operating EBIT margin of 2.8% (previous year: 1.2%). In contrast to the frequently observed, strong year-end dependency, it was possible to noticeably smooth out the earnings development in the reporting year through a strong operational performance that already began in the third quarter. As a result, the dependency on the final quarter for achieving the annual targets was significantly reduced compared to the previous year.
In the reporting year, interest income amounted to €2.9m (previous year: €4.9m), while interest expenses were €26.6m (previous year: €29.0m). This resulted in an interest result of €-23.7m (previous year: €-24.1m), which benefited above all from lower interest rates as well as lower utilisation of credit lines. This led to earnings before taxes of €7.6m (previous year: €-59.2m). The increase in income taxes is essentially influenced by value adjustments on deferred tax assets on loss carryforwards and increased actual tax expenses. After income taxes of €-21.1m (previous year: €-10.6m), the Group net loss was €-13.5m (previous year: €-69.8m). This corresponds to earnings per share of €-0.81 (previous year: €-4.24). Earnings per share improved accordingly by €3.43.
Finances
Cash flow from operating activities amounted to €42.8m in the reporting year (previous year: €73.4m). This development is mainly due to a decrease in inventories and trade receivables, a decrease in prepayments received as well as an increase in contract assets and trade payables. At €-35.6m, cash flow from investing activities was lower than in the previous year (previous year: €-41.8m) due to continued investment discipline. For the full year, this resulted in a positive free cash flow of €7.2m (previous year: €31.6m). After a lock-up of funds typical for mechanical and plant engineering in the course of the year to date, a very strong inflow of funds at the end of the year, driven by active net working capital management, led to this positive result. Net working capital stood at €281.0m as of 31 December 2025 (previous year: €294.2m). It was positively impacted by a supply chain financing optimisation programme with €25.0m (previous year: €17.4m); in addition, effects from changed payment terms contributed to an improvement in the position. Cash flow from financing activities resulted in €-2.8m (previous year: €1.3m), which, in addition to changes in bank liabilities, was also influenced by payments to and from a financial service provider. At the end of December 2025, cash and cash equivalents were valued at €137.5m (previous year: €133.7m). Adjusted for bank liabilities of €261.9m (previous year: €261.8m), the net financial debt amounted to €-124.4m (previous year: €-128.1m).
The Group has access to syndicated credit facilities from a banking consortium with a total volume of €500m. In addition to a revolving cash facility of €300m, the syndicated finance includes a guarantee facility of €200m. The credit facilities have a tenor of five years, thus until October 2028, which can optionally be extended by an additional two years by consensus of the lenders. To highlight the importance that Koenig & Bauer attaches to sustainability in its funding operations, the contract also includes ESG components, which are evaluated annually in a bonus/malus process and, depending on the achievement of the ESG target values, reduce (bonus) or increase (malus) funding costs. The Group-wide external financing framework also consists of further bilateral credit facilities, mainly in the form of guarantee credit facilities.
Assets
As of 31 December 2025, equity stood at €343.1m and the equity ratio at 24.0% (31 December 2024: €331.2m and 23.3%). Equity was essentially strengthened by positive valuation effects from the application of the revaluation method to land and from hedge accounting. The Koenig & Bauer Group`s total assets stood at €1,430.5m as of 31 December 2025 (previous year: €1,422.7m).
Assets
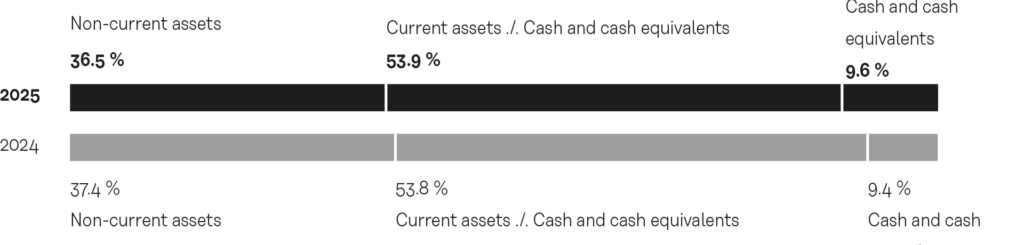
A total of €39.1m (previous year: €52.5m) was spent on property, plant and equipment and intangible assets in connection with construction and IT projects in the period under review. Capital spending includes capitalised development costs of €9.1m (previous year: €12.6m). This was accompanied by depreciation and amortisation expense of €43.0m (previous year: €44.3m). On balance, intangible assets and property, plant and equipment decreased slightly from €402.4m to €400.2m. Non-current assets decreased by €10.8m year-on-year to €521.9m. A major factor here was the decrease in deferred tax assets due to value adjustments and the reduction in the corporate income tax rate by €17.3m to €78.0m (previous year: €95.3m). This was offset by an increase in financial investments and other financial receivables from €10.1m to €27.7m (previous year: €17.6m). This is mainly due to the conclusion of long-term foreign currency forward transactians. Current assets increased by €18.6m to €908.6m as of 31 December 2025 (previous year: €890.0m). The increase in other assets by €31.8m to €205.5m (previous year: €173.7m) contributed to this. This increase is mainly due to an increase in contract assets based on increased performance progress for orders from customer-specific production. Other financial receivables increased by €13.0m to €70.3m (previous year: €57.3m), due to the conclusion of short-term foreign currency forward transactions. By contrast, inventories fell by €16.0m to €352.9m (previous year: €368.9m) and trade receivables by €10.0m to €132.1m (previous year: €142.1m). Here, active net working capital management had a positive effect on the stocks at the end of the year. Cash and cash equivalents increased by €3.8m to €137.5m (previous year: €133.7m). Assets held for sale amounted to €3.1m (previous year: €7.9m). At €1,430.5m, the Group’s total assets were above the figure of €1,422.7m recorded at the end of 2024.
Equity and liabilities
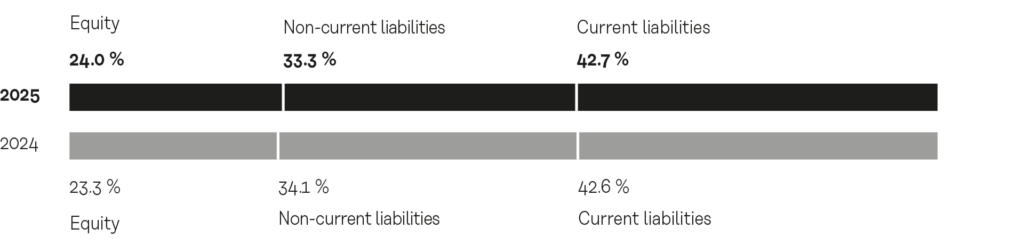
The consolidated net loss of €-13.5m (previous year: €-69.8m) includes extraordinary items for the “Spotlight” focus programme in the amount of €5.3m. Equity was mainly strengthened by positive valuation effects from the application of the revaluation method to land as well as from hedge accounting. Equity thus increased from €331.2m as of 31 December 2024 to €343.1m as of the end of the 2025 financial year, corresponding to an equity ratio at the reporting date of 24.0% (end of 2024: 23.3%). Non-current liabilities decreased by €8.0m to €477.0m (previous year: €485.0m). This was mainly influenced by the decrease in retirement benefit provisions by €9.7m to €95.6m (previous year: €105.3m) due to the discount rate for domestic pensions of 4.1% (previous year: 3.5%), which was above the previous year’s level. Furthermore, non-current other provisions decreased by €5m to €25.7m (previous year: €30.7m), essentially due to reclassifications to current provisions. Conversely, financial liabilities and other financial obligations increased by €4.0m to €274.4m (previous year: €270.4m) and deferred tax liabilities by €3.4m to €78.3m (previous year: €74.9m). Current liabilities increased slightly by €3.9m to €610.4m (previous year: €606.5m). In this process, trade payables increased by €43.9m to €116.1m (previous year: €72.2m) by taking advantage of favourable payment terms. By contrast, financial liabilities and other financial liabilities decreased by €18.8m to €98.8m (previous year: €117.6m), which is predominantly attributable to a decrease in liabilities for outstanding invoices and financial liabilities. Furthermore, other liabilities decreased by €23.0m to €280.5m (previous year: €303.5m). This is predominantly due to a reduction in prepayments received. Current provisions were almost unchanged year-on-year at €111.5m (previous year: €111.0m). Likewise, current income tax liabilities increased only slightly by €1.3m to €3.5m (previous year: €2.2m).
Segment performance
In the Paper & Packaging Sheetfed Systems (P&P) segment, order intake in the 2025 financial year was only moderately lower at €704.0m, down -3.9% from the strong previous-year figure of €732.5m, which was shaped by the world-leading trade fair drupa. The segment thus proved extremely resilient compared to the previous year. A major factor in this performance was again a strong final quarter, which at €203.7m marked the strongest quarter for orders in the reporting year, even though it remained below the exceptionally high previous-year figure (€220.8m) as expected.
The order structure followed global investment trends: while there was a continued high demand for modernisation and replacement investments to increase operational efficiency in the medium format, the large format was characterised by market-wide, temporary restraint in large-volume capacity expansions. In addition to the stable core business, positive momentum emerged in the reporting year for digital printing solutions as well as first tendencies of a recovery in the market for corrugated board systems from its temporary weakness. This confirms that the strategic bundling of folding box, corrugated board and digital printing activities – including cooperation in the Koenig & Bauer Durst joint venture – is achieving the sought-after closer market cultivation in the entire packaging sector.
Revenue increased slightly by 0.9% year-on-year to €741.5m (previous year: €734.8m). Sequentially, revenues improved from quarter to quarter, with the final quarter reaching the annual high at €254.4m (previous year: €268.4m). This development resulted significantly from the consistent processing of the order backlog as well as a stable service performance at the previous year’s level. The service business thus once again formed a reliable basis for the segment’s revenue performance. With a book-to-bill ratio of 0.95 (previous year: 1.00), the order backlog as of 31 December amounted to €369.5m (previous year: €407.0m).
The increase in operating EBIT to €25.0m (previous year: €17.1m) resulted primarily from the absence of the drupa trade fair costs of the previous year. After a balanced result in the first half of the year, the result was increased through a strong operational performance in the second half of the year. The operating EBIT margin consequently improved significantly to 3.4% (previous year: 2.3%). As no non-operating extraordinary items were incurred in this segment in the reporting year, operating EBIT corresponds to EBIT and the operating EBIT margin to the EBIT margin.
In the Special & New Technologies (S&T) segment, order intake in the 2025 financial year amounted to €558.4m and was thus -19.7% below the previous year’s figure of €695.6m as expected. This decline results significantly from a significant base effect in the Banknote Solutions (BNS) business after the exceptionally high previous-year level. Due to the relatively high share of BNS business, the segment’s order intake is subject to greater fluctuations than the industrial customer business due to the characteristics of large-scale state projects. This volatility was also reflected in the reporting year in an uneven quarterly distribution, with the final quarter marking the second-highest value at €183.1m (previous year: €202.9m).
The order structure reflects this pronounced large-project character, which in BNS (banknote and security printing) led to an expected normalisation of ordering activity after the exceptionally strong year 2024 – which was shaped by large orders from the Bureau of Engraving and Printing (BEP), the US federal printing office. Within the web printing solutions, flexo printing presses for the packaging market showed a stable development at the previous year’s level. In contrast, classic web offset presses recorded demand restraint due to long replacement investment cycles in this saturated market, as did web-based digital presses (HP and RotaJET) as a result of US tariff uncertainties. In contrast, the Coding (marking solutions for all industries), Kammann (direct decoration of glass and plastic hollow containers) and MetalPrint (metal packaging) business units recorded encouraging dynamism in their core business as well as in digital printing solutions, with order intake above the previous year. The broad positioning of the S&T segment thus confirms the sought-after diversification in specialised growth markets.
Revenue increased by 6.8% to €596.0m in the 2025 financial year (previous year: €558.0m). Revenue performance was sequentially rising over the course of the year, with the final quarter marking the annual high at €199.1m (previous year: €190.8m). This positive development resulted in particular from performance progress on banknote projects as well as stable service performance. With a book-to-bill ratio of 0.94 (previous year: 1.25), the order backlog as of 31 December stood at €598.2m (previous year: €635.8m), thus continuing to form a very solid basis for the coming financial year.
Operating EBIT improved significantly by €24.4m to €9.0m for the full year (previous year: €-15.4m). After a first half of the year which, as usual, was shaped by a high level of work in progress, the significant increase in earnings in the second half of the year resulted from the scheduled delivery and acceptance of these systems. In parallel, the efficiency increases already measurable from the “Spotlight” focus programme contributed substantially to the operational turnaround. The operating EBIT margin thus reached 1.5% (previous year: -2.8%). In the course of the final implementation of “Spotlight”, non-operating extraordinary items of €2.8m were incurred proportionately in the segment in the reporting year. Taking these effects into account, EBIT improved significantly to €6.2m (previous year: €-58.5m), corresponding to an EBIT margin of 1.0% (previous year: -10.5%)